A real estate company with a purpose. Our mission is to help
Compass National Market Insights - September 2025 Report
Javada Hill
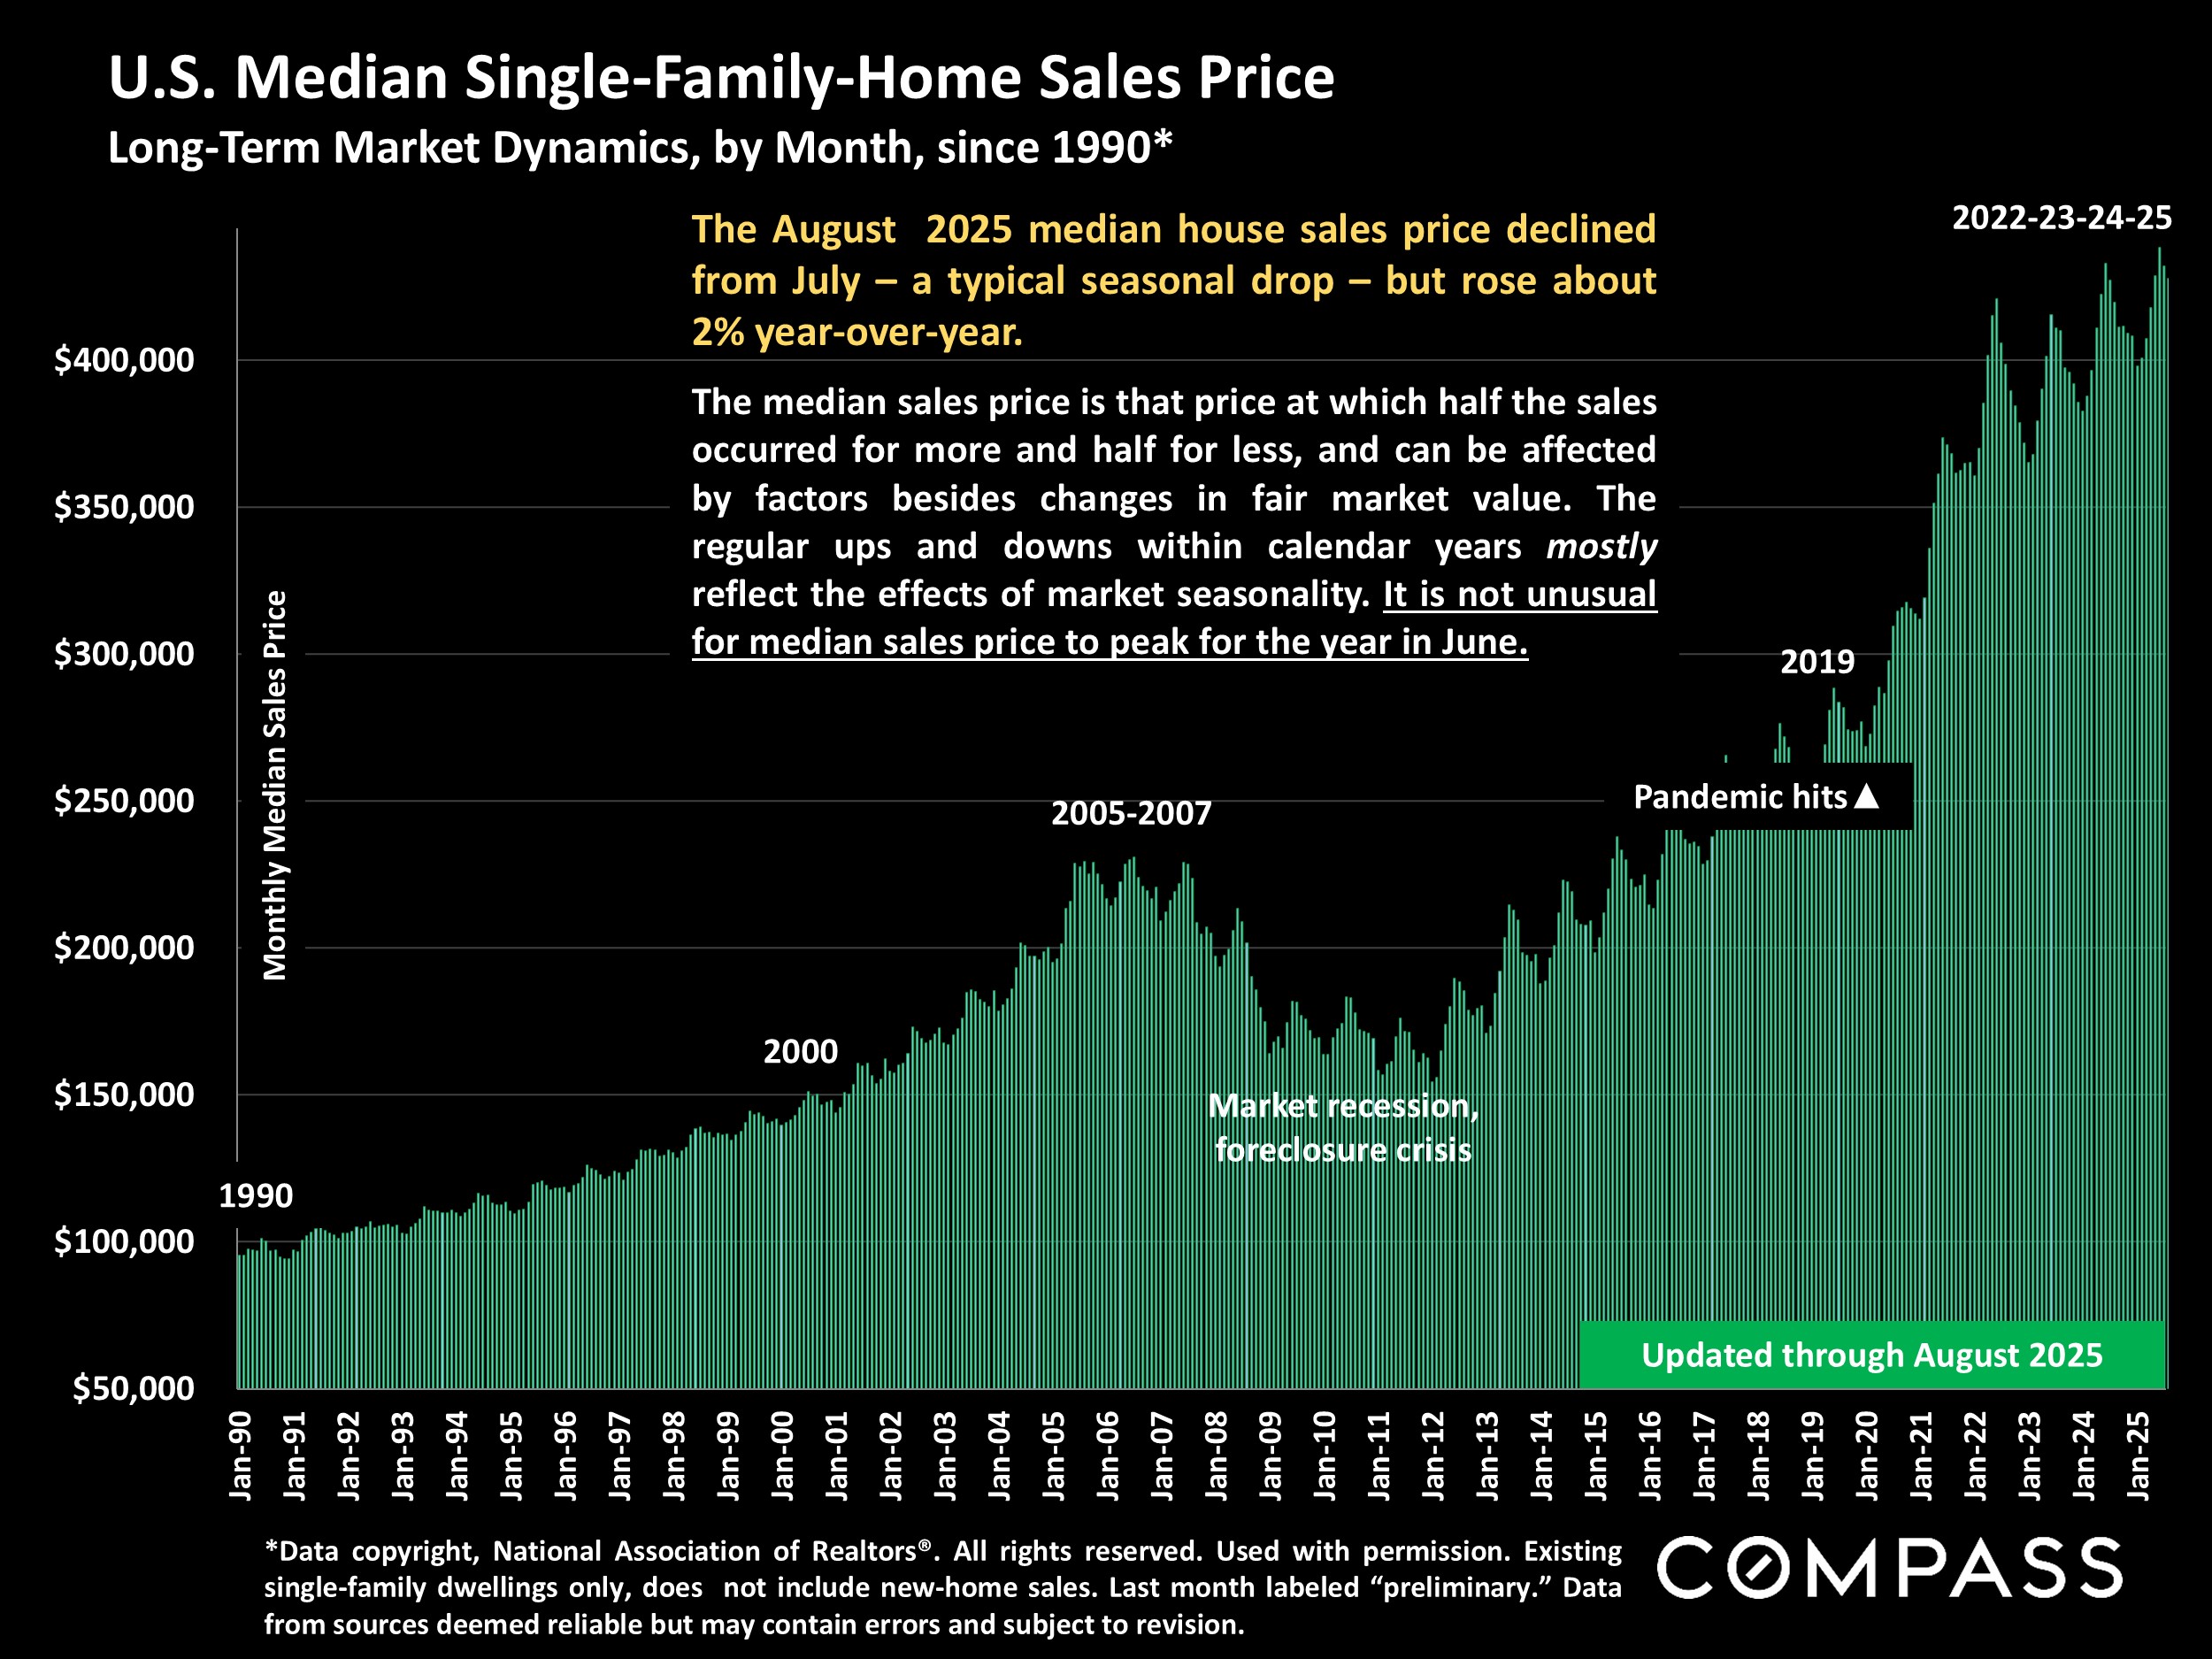
The median existing-house median sales price continued to rise on a year-over-year basis, as did the median condo/co-op price. One factor - in addition to general appreciation trends - is that affluent buyers, purchasing more expensive homes, have been playing an increasing role in demand since stock markets began soaring in early 2024. This helps pull median sales prices higher.
The chart below reviews monthly median home sales prices since January 2020 by the 4 major regions delineated by the National Association of Realtors. Appreciation since spring 2022 - typically considered the peak of the pandemic boom, before interest rates soared - has continued unabated in the Midwest and Northeast regions, while prices in the South and West, after huge gains during the pandemic, are basically flat over the last 3+ years. Note that these regions contain thousands of markets of varying prices, conditions and trends.
The number of new listings coming on market has substantially declined from the multi-year high reached in April 2025, but was still 5% higher year over year in August.
The number of homes on the market continues to run at its highest count since 2019. Though year-over-year percentage increases have been getting smaller in recent months, the August number was 21% above August 2024.
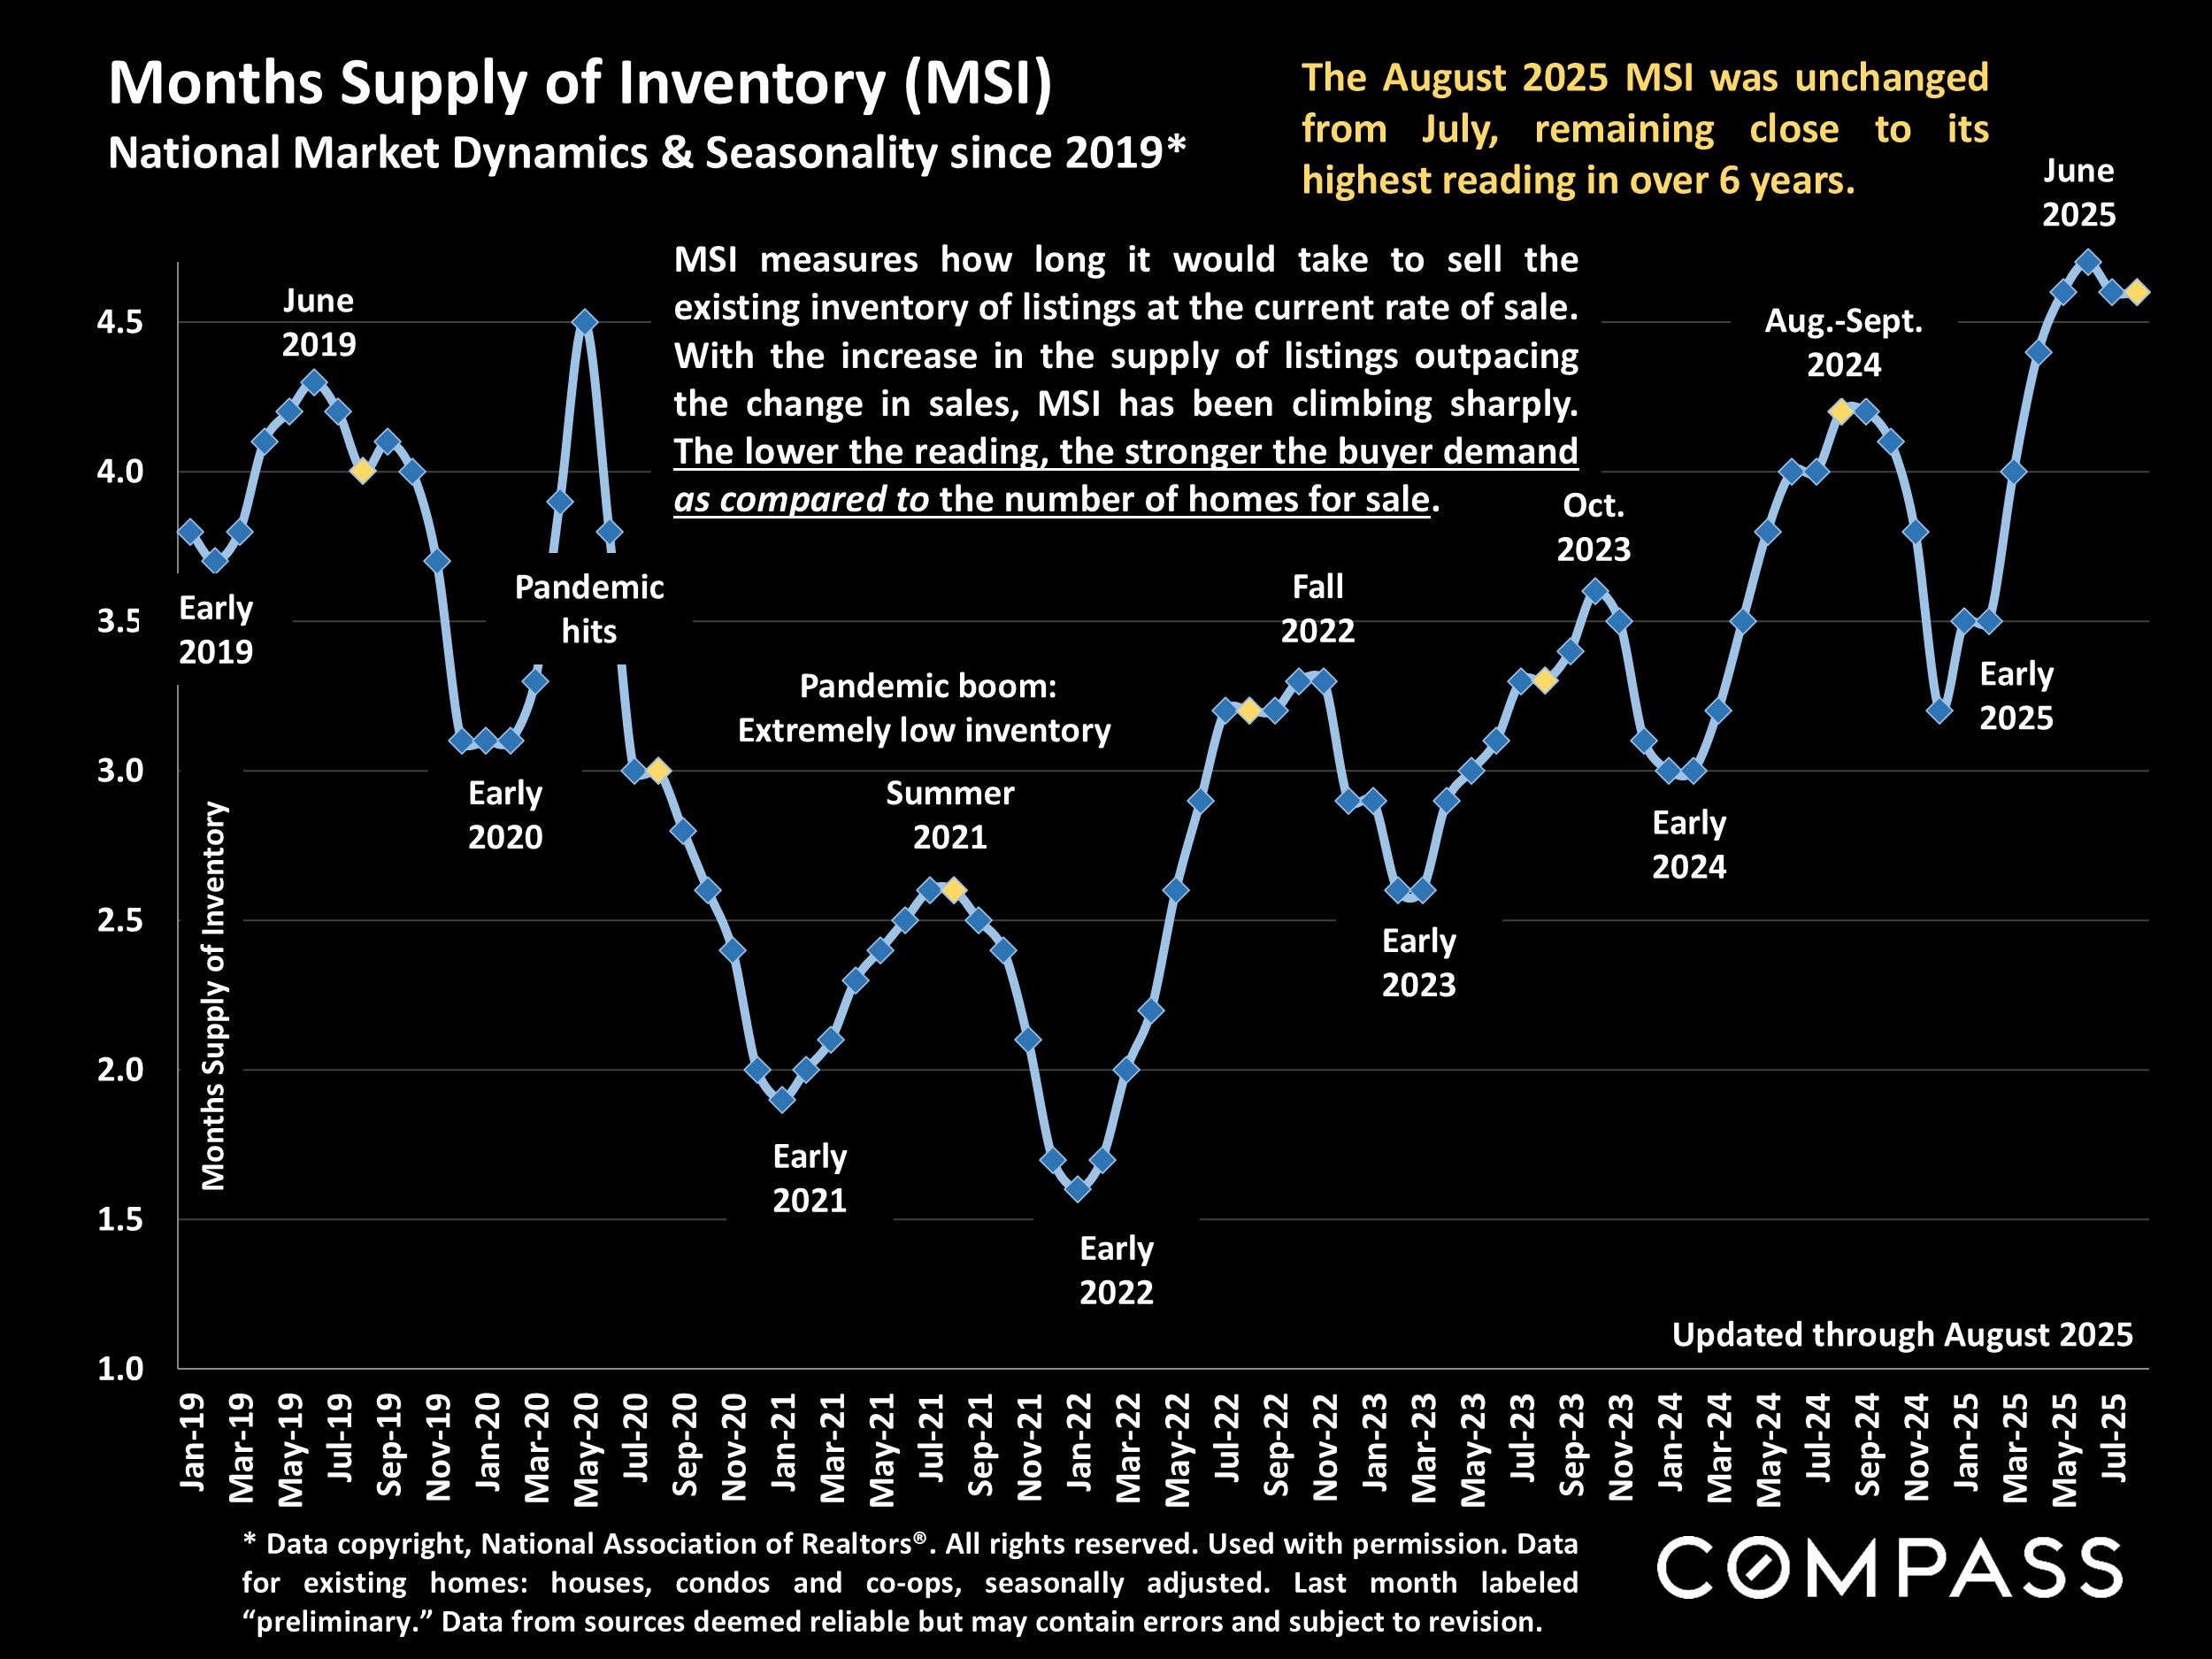
Months-supply-of-inventory (MSI) compares buyer demand to the supply of homes available to purchase. The lowest readings, such as during the pandemic boom, signify heated seller's markets, while higher readings favor buyers. With the substantial year-over-year increase in inventory amid a relatively flat level of demand, MSI in recent months has been running at a 6+ year high. As with virtually all real estate statistics, MSI also rises and falls to seasonal supply & demand trends.
The 12-month-rolling average of home sales is a broad measurement useful for illustrating long-term trends, and by that calculation, the number of sales has been bumping along at a very low count similar to the great recession. Hundreds of thousands of homes still sell every month - many sell very quickly for over list price - but pricing, preparation and marketing are currently of vital importance for sellers.
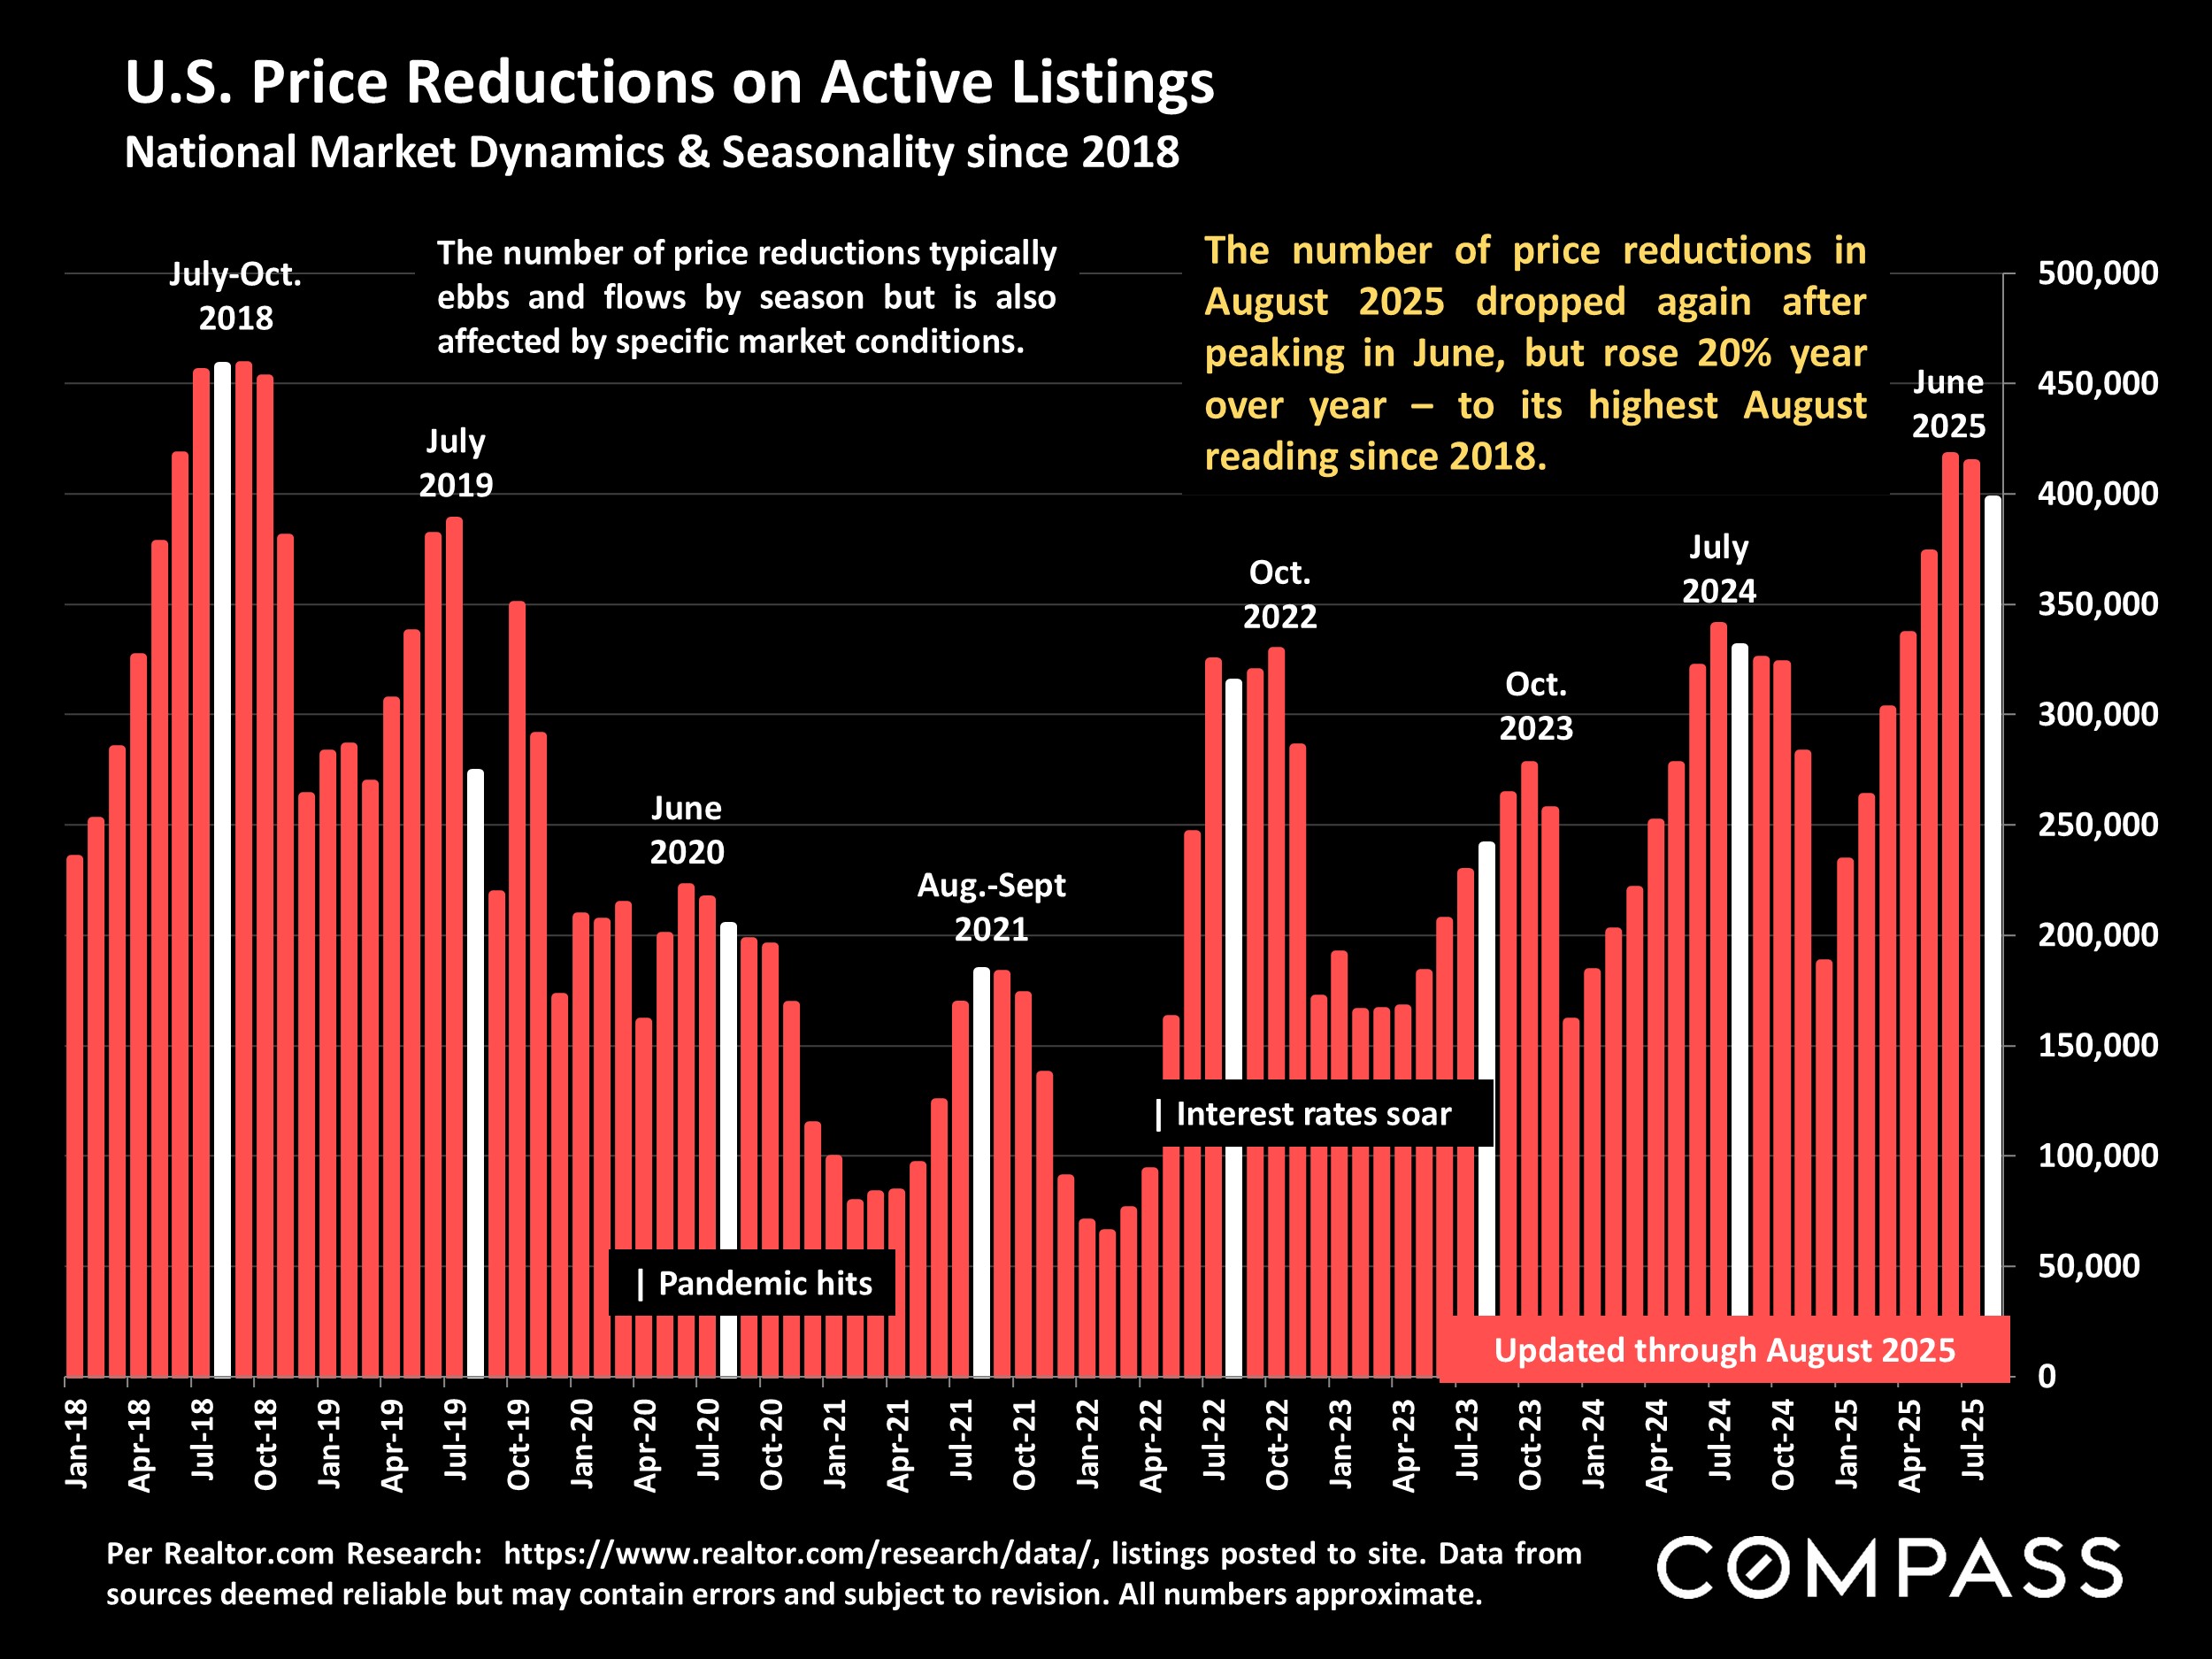
Two of the clearest indications of market cooling are year-over-year increases in price reductions (1st chart below) and time on market (2nd chart). As mentioned before, these situations can offer considerable opportunities for buyers: You might find the home of your dreams in a brand-new listing, but excellent deals are often found in homes that did not sell quickly - in many cases for no other reason than they were priced too high to begin with.
And below are charts illustrating macroeconomic indicators mentioned in the report introduction - indicators pointing in a variety of directions.
Amid large, countervailing economic and political pressures, the Fed reduced its benchmark rate by .25% in September, with most analysts predicting further reductions in the 4th quarter.
The weekly average 30-year mortgage rate ticked up slightly after the Fed cut its benchmark rate on 9/17/25, but remained well below rates prevailing since 2025 began. Where it goes from here will play a major role in the fall selling season.
Inflation has been gradually rising since hitting its 4-year low in April. And according to surveys, general consumer expectations are that it will rise further.
New job creation has plunged in recent months as the unemployment rate has ticked up to tie its highest reading since 2021. Employment security is another significant concern among consumers, especially among low and middle income segments.
Economic volatility and uncertainty has plummeted since April's tariff shock, but remains elevated by long-term standards.
Stock markets have reached successive new highs in August and September.
Please let me know if you have any questions
or if I can be of assistance in any way.
Javada Hill
R.E. Salesperson
M: 215.704.5057
O: 610.822.3356
javada.hill@compass.com
National and regional statistics are generalities, essentially summaries generated by thousands of unique, individual listings and sales occurring across different market segments. They are best seen not as precise measurements, but as broad, comparative indicators with reasonable margins of error. Anomalous fluctuations in statistics are not uncommon, and last period data should be considered preliminary estimates which may be revised in future updates. Different analytics programs sometimes define standard statistics - such as "active listings," "days on market," and "months supply of inventory" - differently: What is most meaningful are not specific numeric calculations but the trends they illustrate. Data from sources deemed reliable, but may contain errors, and subject to revision. All numbers to be considered approximate, and how these analyses apply to any particular property is unknown without a specific comparative market analysis.
Office: 610-822-3356
Compass RE is a licensed real estate broker. All material is intended for informational purposes only and is compiled from sources deemed reliable but is subject to errors, omissions, changes in price, condition, sale, or withdrawal without notice. No statement is made as to the accuracy of any description or measurements (including square footage). This is not intended to solicit property already listed. No financial or legal advice provided. Equal Housing Opportunity. Photos may be virtually staged or digitally enhanced and may not reflect actual property conditions.